I have wanted to see the state of my 2013 Nissan Leaf battery pack ever since I purchased the car years ago. I even considered buying "Leaf Spy" but never could justify it just to satisfy my curiousity. But now that I have OVMS I'd like to know how to interpret the BMS graph.
I've asked before... Is there documentation somewhere that covers this topic? I hate to keep asking questions that may already answered in some OVMS docs somewhere.
-Wes
User guide update:
@Dexter: I didn't know you could adjust the alert thresholds; I'm going to do that next time I'm able to load the console UI (WiFi).
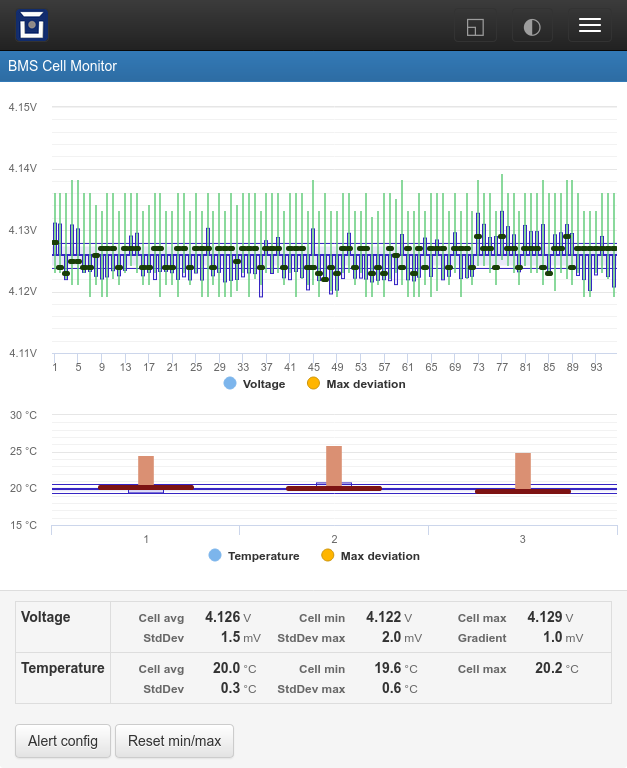
@Wes: One of the biggest uses/benefits of the BMS graph is to detect/monitor "weak cells" (I have one). Looking along the "voltage" line in the table, you need to look at the delta between the minimum and maximum cell voltages (seems to be <10mV accounting for max deviation). That's good, but I know there is a metric/parameter that actually calculates this for you (the same thing that's used to give "cell deviation" alerts). I monitor this with a "metrics list" command from the app, so I don't know if there's something missing from the web UI.
The max cell deviation is something that is readily displayed in LeafSpy. For the record, there are other things that LeafSpy does (like report battery AHr capacity and reset DTCs) that makes it a useful tool for Leaf owners.